

You are going to eat, breathe, and crap data sheets. So it’s a good idea to get used to how datasheets present the data on the…uh, sheet. Most data sheets pre-date electronic files so they’re likely to be huge ass PDFs scatter all over the friggin’ web. It’s kind of annoying and it’s also kind of like a fun detective mystery every time you want to look something up. Ok, it’s mostly the former. Hit it, Sherlock.

General (1) – This section usually contains heater voltage and current information. It’s often one of the first things to look at when you’re working with a known power transformer (to make sure it has the right heater voltage tap and can handle the current). Input capacitance, usually near the bottom of the general section, is also important when you start considering the Miller Effect.
Pinout/Terminal Connections (2) – This diagram is viewed from the bottom of the tube or socket (the side you’re adding wires to). When in doubt as to the pin number, count clockwise from the gap or the key on the tube base from the bottom of the socket. Below the diagram in this picture is a description key, but some pinouts will use letters on the diagram to refer to the electrodes: “H” for heater, “K” for cathode, “P” for plate, “G” grid, etc “G2” for screen, etc. Shit, did I forget to mention tube pins are displayed in the diagram from the bottom?
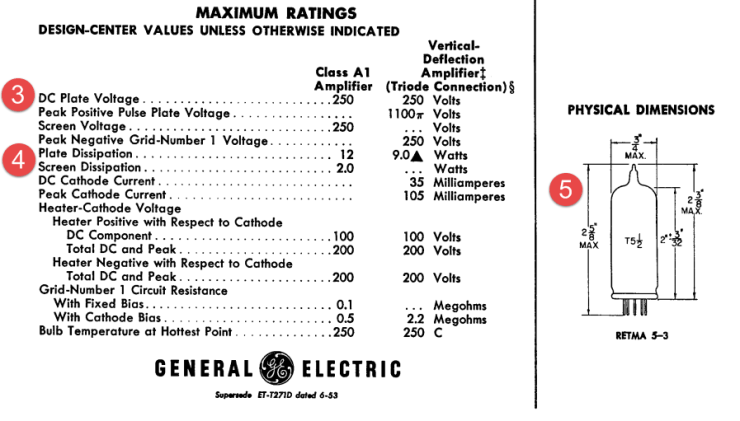
Maximum Ratings (3) – Although we all love to achieve maximum power and danger, we should (usually) respect the maximum ratings on the data sheet. DC plate voltage is one rating to pay special attention to. Keep in mind that this is the maximum voltage applied across the tube; your B+ voltage in the circuit may be higher (if dropped across a load resistor, for example). Maximum heater-to-cathode voltage is also an important consideration when referencing your heater string or building ‘totem pole’ style topologies.
Dissipation Ratings (4) – This is how many watts of power you’re pushing through the tube (not the same as how many watts of sound the tube makes). Calculate it with the voltage across the tube multiplied by the current through the tube (W = V * I). Running a tube at maximum dissipation usually shortens its lifespan, so many people shoot for 10-20% lower than max.
Physical Dimensions (5) – Sometimes I use this if I have size constraints. Not much though. I guess I just wanted to point it out.
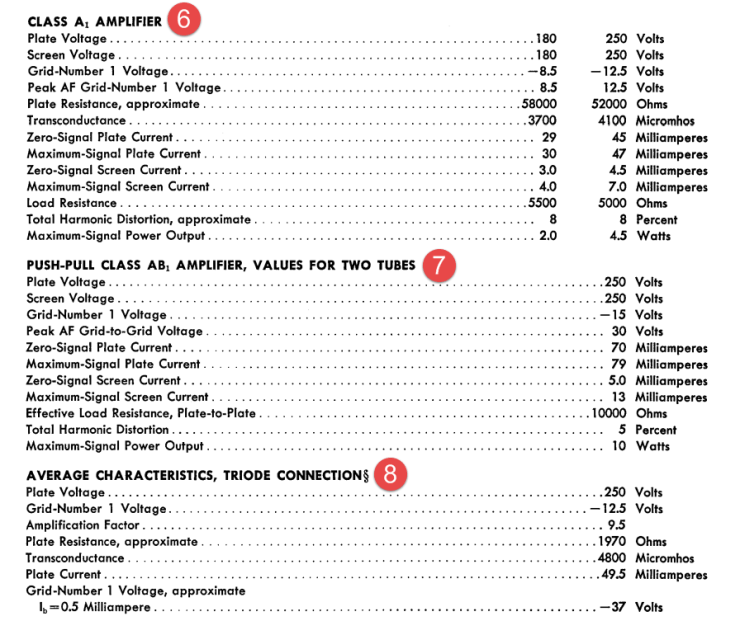
Class A Amplifier (6) – Most (not all) amplifiers you’re going to find for audio (hifi) are going to be class A. The tube that this data sheet came from is a beam pentode, so the class A ratings in this picture are a suggestion for running it as a pentode. It’s basically a little recipe for how to run the tube and what you’ll get. Give it a 5,000 ohm plate load, a -12.5 volt bias, 45 mA current at the quiescent point (about a 270 ohm cathode resistor), and you’ll be rewarded with 4.5 watts of output at 8% THD.
Push-Pull Class AB (7) – More or less ditto the above. This is a down and dirty recipe for two tubes in push pull operation. These recipes are sometimes a good starting point, but they also usually run the tubes at maximum everything because men were real men back in the day.
Triode Connection (8) – Here are some numbers for the same tube triode strapped (screen connected to plate). This particular sheet doesn’t include the power output for triode, but if you look for other sheets for the same tube, you may find more information.
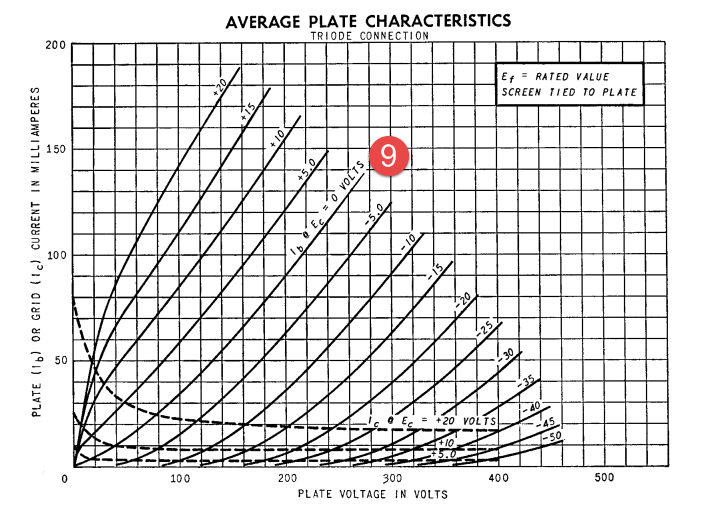
Triode Curves (9) – Them’s the taters right there. We’ll cover load lines in another section, but know that you find these curves in the data sheet. We’re lucky that this pentode tube does include the triode data as well. It’s not always the case. Note that this graph includes positive grid values as well. Normally you’re just going to look at the 0 volt line and to the right of it.
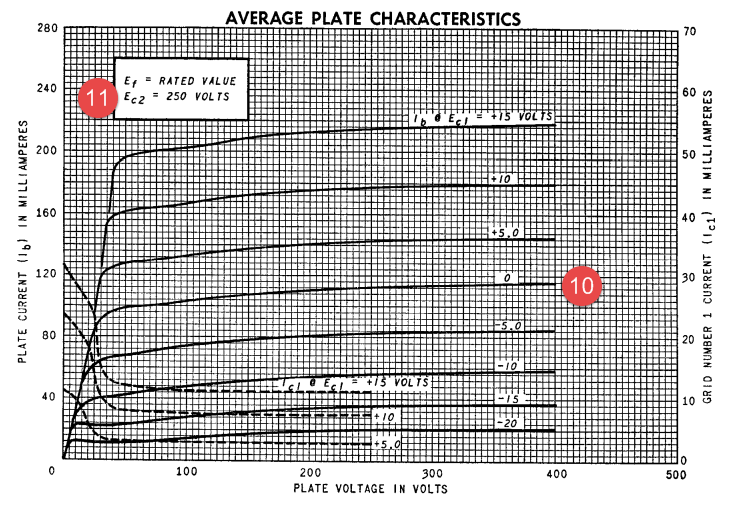
Pentode Curves (10) – Here are the pentode curves. The red dot is just to the right of the 0 volt control grid line. Most data sheets will have multiple pentode curves. That’s because pentodes have more than one grid and so both variables (control grid and screen grid) cannot be included on one 2D graph in an intelligible way (for humans, at least).
Pentode Curves Screen Value (11) – Here the screen grid voltage is listed to give more context to the curves. In this case, it lists a screen (Ec2) voltage of 250 volts This data sheet set also includes other pentode curve graphs for different screen voltages (not pictured).
You’re going to do a lot of looking at tube data sheets, so get familiar with the layout and what is (and isn’t) included. Different manufacturers may include different information, so it never hurts to check multiple versions of a tube’s datasheet if you want some particular spec.
